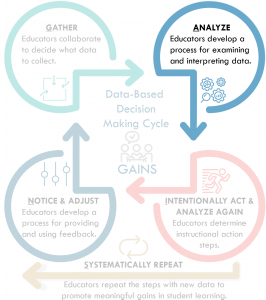
EF2: Educators implement a process for examining and interpreting data

Essential Function 2 is all about using a purposeful data review and analysis procedure to identify and define a problem, and to select data points to monitor progress of any agreed upon actions.
In the case of using office discipline data to solve schoolwide problems, problem identification and analysis center around what are sometimes called the Big 5 Questions:
- What (behaviors)?
- Where (are ODRs occurring)?
- When (are ODRs occurring)?
- Who (are the students engaged in unexpected behaviors)?
- How often (frequencies of all of the above)?
Problem Identification:
A big 5 data report is a frequency report that provides the answers to these questions, and helps the team identify a problem to solve. The Big 5 Data Report includes:
- Frequency of ODRs per day per month
- Frequency by type of behavior
- Frequency by location of incident
- Frequency by time of incident
- Frequency by students or student group
Schools collect this data on their ODR form. Typically, this data is then entered into an electronic data management system (MO SW-PBS Data Collection Tool, SWIS, etc.), although teams can tally the information at the end of each month. For more information about designing an ODR form, refer to the PLM on ETLP 4: Discouraging Unexpected Behavior.
The team uses this initial Big-5 Data Report to identify a problem on which to focus. They can select this problem from any one of the following four Big 5 categories: behavior, location, time, or students. They will select only one problem on which to focus. They can use frequency as their main criteria, but it is not necessarily their only criteria.
For example, a review of the Big 5 data report reveals the following:
- How Often: 1.5 ODRs per day per month in January
- What: Physical Aggression and Disruption (14 each)
- Where: Classroom (16)
- When: 12:45 PM (6)
- Who: 42 ODRs evenly distributed among 31 students; most are from grade 6 (16)
The team could select one of these hot spots (what, where, when and who) as the problem they will solve (Frequency per day per month is used to monitor progress month to month and year to year, and for annual problem prevention, but not for selecting a monthly problem to solve).
The following guidance can help teams narrow their focus to one problem to solve:
- Consider the number of ODRs potentially impacted (PBISAPPS, 2014).
- Select a problem that will give you the biggest change for the least amount of effort (Horner, 2011).
- Focus area should involve 10 or more students.
- 10+ = Systems Issue (Horner, 2016).
- Consider student safety (PBISAPPS, 2014).
If the team from our example were just considering frequency, they would probably choose to solve problems occurring in the classroom (16 ODRs) or problems involving 6th graders (16 ODRs). However, because physical aggression compromises student safety, the team elects to solve for the problem, physical aggression (14 ODRs).
Problem Analysis:
Once the team has selected a problem from the initial Big-5 data report, they analyze data related to the problem to better define it. Analysis is pretty simple: filter out all ODR information except information associated with ODRs related to the problem. Then, answer the questions “what?”, “where?”, “when?” and “who?” as they relate to the problem area. While this is much easier with a good electronic data management system, it, too, can be done by hand. Simply separate the ODRs related to the problem from the others, then tally the data on this subset of ODRs.
Using our physical aggression problem from above, the team pulls out the 14 ODRs that involve physical aggression. They set the remaining ODRs aside. They then tally up the Big 5 questions as they relate specifically to the incidents involving physical aggression. They find:
- What: Physical Aggression (14)
- Where: Hallways (10)
- When: 1:00 PM (4)
- Who: 6th (6) and 7th Graders (8)
- How Often: (in parentheses)
There are several things to notice about the data after we filtered out the extraneous information. First, the most frequent location, time of day, and students involved changed from the initial Big-5 Report. This is because the way ODRs were distributed in the aggregate report masked the way ODRs involving physical aggression were distributed. The second point is more obvious: our initial problem already answers one of the “what?”, “where?”, “when?” and “who?” questions; the team merely needs to answer the three remaining questions. In our example, we are trying to solve the problem of physical aggression, and therefore, separate out the 14 ODRs for physical aggression. They already know “what?” (14 ODRs for physical aggression), so they just need to identify where the physical aggression incidents are occurring, when are most physical aggression incidents occurring, and who are the students most frequently engaged in physical aggression. Finally, after filtering out all of the extraneous data and answering “what?”, “where?”, “when?” and “who?” questions related to our problem, we are left with a precise definition of the context surrounding our problem. This allows us to narrowly focus our action steps in a way that addresses the problem in the specific context in which it is occurring. In the case of our example, we can now say “Physical aggression is occurring primarily in the hallways at 1:00 PM, and primarily by 7th graders.”
Activity: If the team had not analyzed the problem, they might have incorrectly treated the initial problem statements as a single statement, such as “6th grade students are engaged in physical aggression in the classroom at 12:45.”
Compare this to the precision problem statement: “Physical aggression is occurring primarily in the hallways at 1:00 PM, and primarily by 7th graders.”
Question: How would you address each of these? In what ways would your intervention be the same or similar? How would they be different?

